Troubleshooting CAD+ Toolset for SOLIDWORKS
In order to optimize the bug fixing and bug capturing process, CAD+ enables detailed logging into multiple sources.
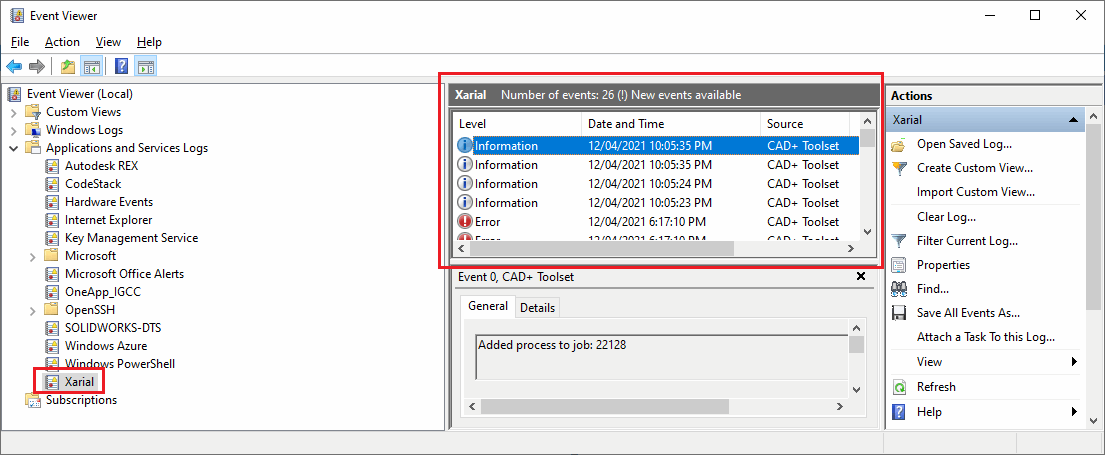
Event Viewer Log
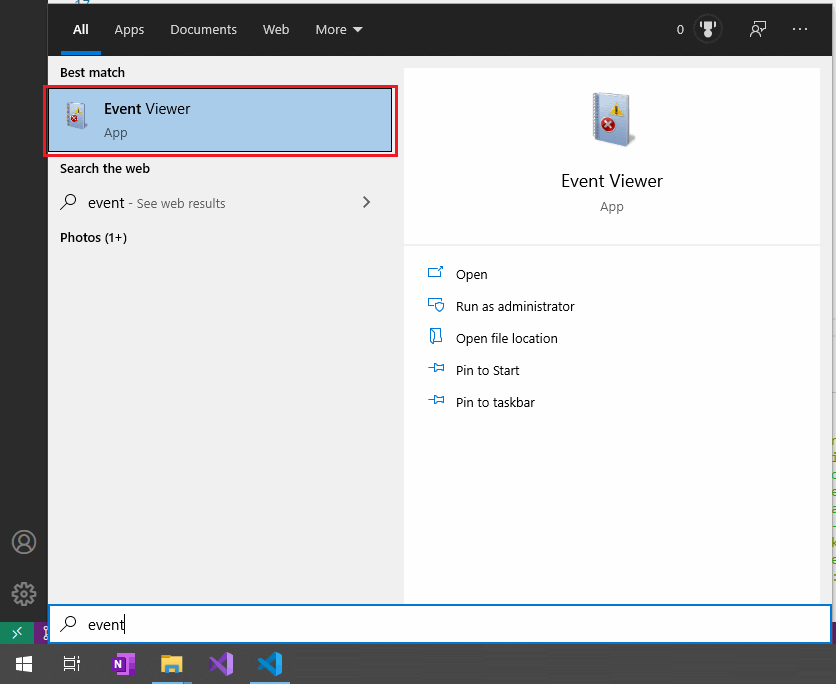
Minimal logs are captured into Windows Event Viewer. It can be accessed by typing Event Viewer into the Windows start menu:
CAD+ logs will be displayed under the Xarial category.
Verbose Logging
CAD+ supports several levels of logging. By default, only critical messages will be logged. But verbose logging can be enabled, so more messages will be output. In order to enable verbose logging, Download verbose logs settings file and place it into the %localappdata%\Xarial\CADPlusToolset directory.
Trace
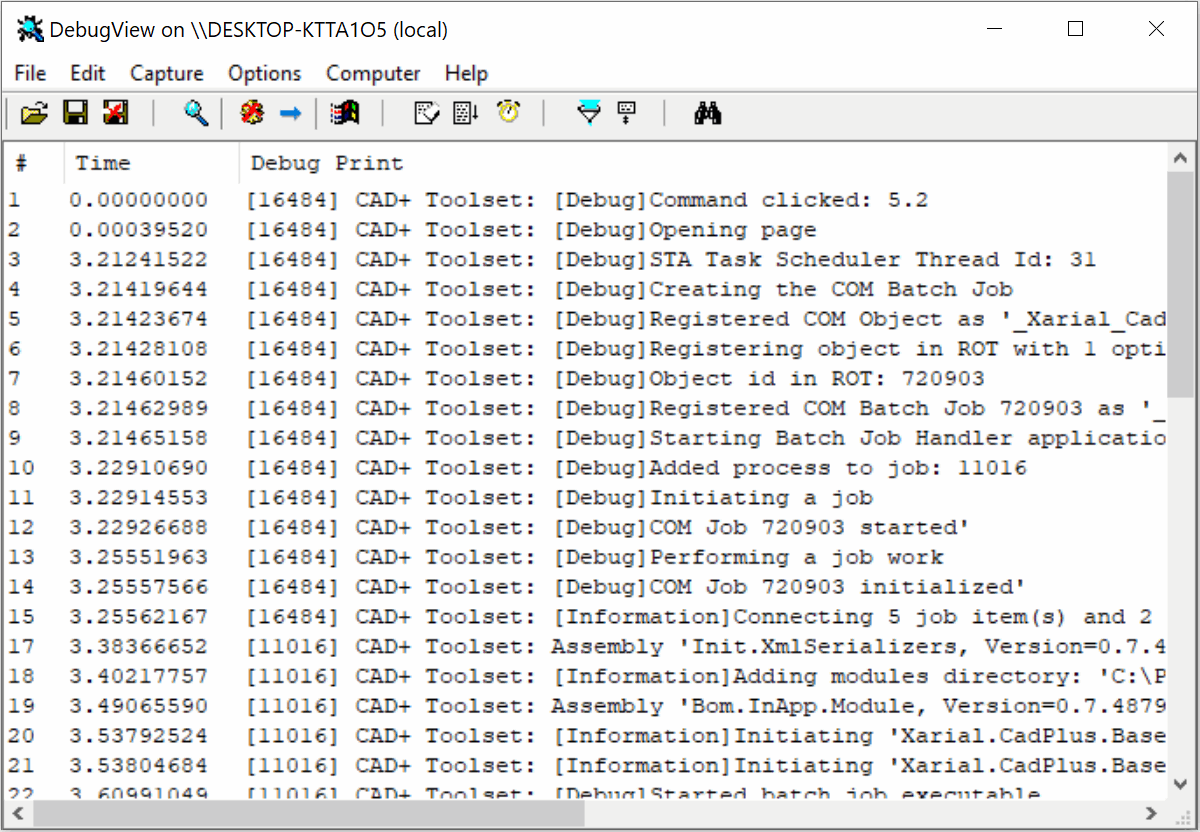
Detailed log messages will be output into the trace window. It is possible to use any trace listener tool to capture the log. Unlike Event Viewer Log, trace message will only be captured into the active session of the trace listener, e.g. the trace listener tool must be running before the log to be captured.
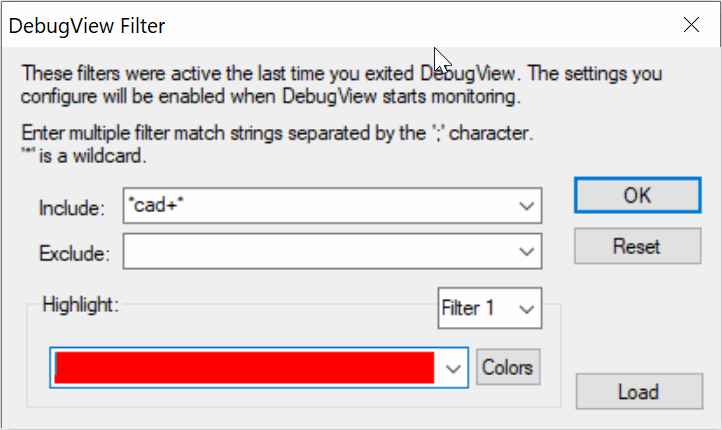
To capture the trace messages
- Download the DebugView tool (or any other trace listener)
- Unzip the archive
- Run dbgview64.exe executable
- Specify *cad+* for the filter
- Reproduce the issue. Window will capture messages from the CAD+ Toolset
- Please save the log into a text file and e-mail it to mailto:support@xarial.com for troubleshooting
You can clear the trace messages by clicking the Clear (Ctrl+X) button
If trace messages are not captured
- Make sure it is only one instance of DebugView is running
- Make sure that Capture Win32 (Ctrl+W) and Capture Event (Ctrl+E) options are checked under the Capture menu command